
Research
AI Overviews and Paid Search CTR
Do Google AI Overviews cut paid search CTR? Seer's 2025 study said down 68% and its 2026 study says up. Both hold, for different queries. Checked October 2026.
Key figures
- Paid CTR on queries showing an AI Overview, February 2026 (Seer Interactive 2026 study, 53 brands, three intents)
- 16.2%
- Paid CTR on queries showing an AI Overview, September 2025 (Seer Interactive September 2025 study, 3,119 informational queries)
- 6.34%
- Size of the 2026 query set against the 2025 one, derived on this page from Seer's own counts
- about 1,750x
- Share of queries showing an AI Overview: informational, commercial, transactional (Seer Interactive 2026 study)
- 36% / 8% / 5%
- Change in non-brand Google Search CTR for B2B advertisers, 2025 against 2024 (Dreamdata customers, Dreamdata's own data)
- -26.16%
Two editions of the same agency’s study answer this question in opposite directions, and most pages citing either do not say which one they mean. This page puts all three editions of Seer Interactive’s AI Overview study side by side, with the queries behind each number, for anyone running Google Search ads or writing about them.
What the 2026 study says {#v3}
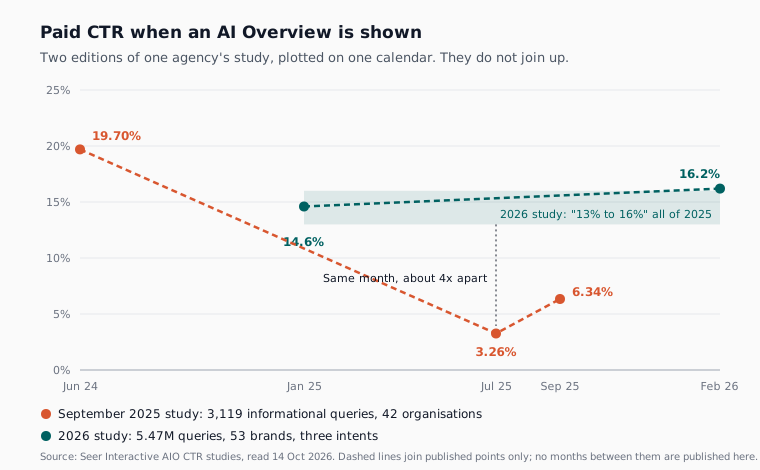
Seer Interactive’s AIO Impact on Google CTR: 2026 Update, published 24 April 2026, tracked 53 brands from January 2025 to February 2026: 5.47 million queries, 2.43 billion organic impressions and 296.9 million paid impressions, across informational, transactional and commercial intent. On queries where an AI Overview is shown, paid click-through rate rose from 14.6% in January 2025 to 16.2% in February 2026. On queries with no AI Overview, paid CTR fell from 26% to 21.8% over the same window, which Seer describes as a decrease of about 16%.
That is a rise of 1.6 percentage points on AI Overview queries: derived on this page, 16.2% minus 14.6%, both from the 2026 study, January 2025 and February 2026. Queries with an AI Overview still earned fewer paid clicks per impression than queries without one, but the gap narrowed from 11.4 points (26% minus 14.6%) to 5.6 points (21.8% minus 16.2%), so it roughly halved: derived on this page from the same four published figures.
The same study says paid CTR on queries with an AI Overview stayed within a 13% to 16% range throughout 2025 and into 2026, and that its forecasting model, built on 2025 data, predicted one paid segment within 0.09 percentage points in January 2026 while missing organic CTR by 0.6 to 2.6 points in every segment. Seer’s own reading, as of April 2026, is that paid search is the most predictable lever in search right now.
What the September 2025 study said {#v2}
Seer’s AIO Impact on Google CTR: September 2025 Update, dated 4 November 2025 on its page, tracked 3,119 informational and educational queries across 42 client organisations from June 2024 to September 2025, with 25.1 million organic and 1.1 million paid impressions. Paid CTR on queries with an AI Overview fell from 19.70% in June 2024 to 3.26% in July 2025, then recovered to 6.34% by September 2025, a fall Seer gives as 68%. On queries without an AI Overview, paid CTR fell from 19.1% to 13.04%, which Seer gives as 32%.
That page gives the paid fall as 68% in its data section and as 65% in its strategy section. Its own inputs support 68%: derived on this page, (19.70 - 6.34) / 19.70 = 0.678, from the September 2025 study as read on 14 October 2026. This is the edition most of the citing web still links to, and the 68% is the number usually quoted from it.
Why both are true {#cohorts}
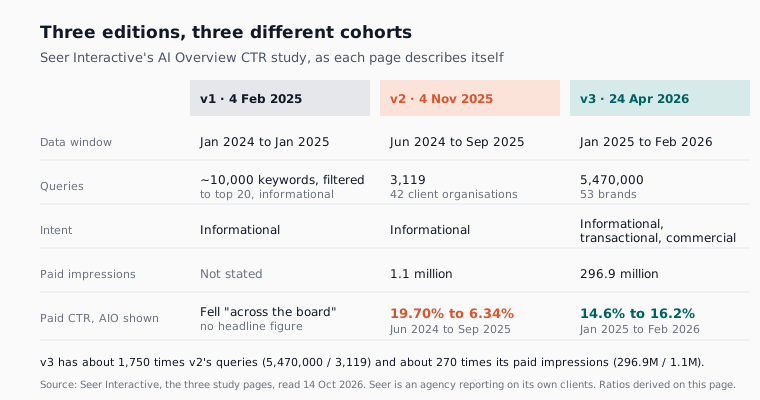
The two studies do not measure the same queries. The September 2025 study used informational queries only, chosen because they are the most exposed to AI Overviews. The 2026 study added transactional and commercial queries and is about 1,750 times larger by query count (derived on this page: 5,470,000 / 3,119 = 1,753.8) and about 270 times larger by paid impressions (296.9 million / 1.1 million = 269.9), both from the counts each page publishes, read 14 October 2026.
The clearest sign is a month both studies cover. For July 2025, the September 2025 study puts paid CTR on AI Overview queries at 3.26%, while the 2026 study says the same metric held within 13% to 16% all year. The bottom of that range is almost exactly four times the July figure (derived on this page: 13 / 3.26 = 3.99). Same agency, same month, same label, a four-fold difference: that is two different groups of queries, not a trend reversing. So “down 68%” and “rising since January 2025” are not a contradiction, and neither one continues the other.
The first edition, Seer’s February 2025 study, covered January 2024 to January 2025 and started from about 10,000 keywords filtered to informational queries ranking in the top 20. It reported organic CTR on AI Overview queries falling from 1.41% to 0.64% year on year, and said paid CTR dropped across the board whether or not an AI Overview appeared. Its text gives no headline paid CTR for queries with an AI Overview, so none is carried here.
How much paid search is exposed {#exposure}
How often an AI Overview appears depends heavily on intent. In the 2026 study, informational queries showed one 36% of the time, commercial queries 8% and transactional queries 5%. Within 30,842 tracked informational queries, comparison queries triggered an AI Overview 95.4% of the time (267 of 280) and question-format queries 85.9% of the time (1,214 of 1,413), as of April 2026.
For a SaaS advertiser that split matters more than any headline. If most of your non-brand budget sits on commercial and transactional terms, Seer’s figures suggest a small share of those auctions share a page with an AI Overview. If you buy “what is” terms, how-to terms or “X vs Y” comparison terms, which Seer classes as informational, assume most of them do.
What B2B account data adds {#b2b}
One account-level data point comes from B2B advertisers rather than an agency’s client mix. The Dreamdata LinkedIn Ads Benchmarks Report 2026, published 10 March 2026 and covering calendar 2025 across Dreamdata’s B2B customers, recorded non-brand Google Search CTR down 26.16% and cost per click up 29.36% against 2024, according to PPC Land’s write-up of the report, read 14 October 2026. The same write-up says the share of B2B paid budgets going to non-brand search fell from 37% to 33%, and that the report attributes part of the CTR fall to AI answers that satisfy a query without a click.
That attribution is Dreamdata’s claim, not a measured cause. Dreamdata sells B2B attribution software and is reporting on its own customers, and the report itself is gated and was not opened for this page. It also measures a year-on-year change across all non-brand search, not a split by AI Overview presence, so it cannot be set against either Seer figure as a like-for-like check.
What this means if you are running ads {#running}
Neither study is your account. The useful step is to split your own non-brand search terms by intent, watch CTR on informational and comparison terms separately from commercial ones, and judge cost per click on its own numbers rather than inferring it from CTR. If you want that kept up every week, Atlas runs Google Ads for SaaS inside limits you set, with changes you approve and can undo. Atlas lives at app.saasadsstudio.com.
For which benchmark measures what, see SaaS Ad Benchmark Sources and Why Google Ads Benchmarks Miss SaaS, and the rest of our research pages.
Method {#method}
Every figure on this page was read off its source page on 14 October 2026. No figure comes from Atlas account data.
Seer Interactive is an agency reporting on its own clients, so every Seer figure is a claim about that client base, not about Google search as a whole. In the 2026 study, intent is classed by SERP features, AI Overview status is a static label from the most recent SERP snapshot applied back across every month, and there is no seasonality adjustment. That means “queries with an AI Overview” in January 2025 are queries that showed one in the latest snapshot, not necessarily in January 2025. The 2026 study’s March 2026 projections are not used here.
The derived figures, each worked from the numbers published in the 2026 study and the September 2025 study, read 14 October 2026: the 1.6 point rise (16.2% minus 14.6%); the gap narrowing from 11.4 to 5.6 points (26% minus 14.6%, then 21.8% minus 16.2%, and 5.6 / 11.4 = 0.49); the 67.8% fall ((19.70 - 6.34) / 19.70); the query ratio (5,470,000 / 3,119 = 1,753.8); the paid impression ratio (296.9 million / 1.1 million = 269.9); and the four-fold July gap (13 / 3.26 = 3.99). None of them is a measurement.
Three inconsistencies were found on the source pages, the February 2025 study, the September 2025 study and the 2026 study, read 14 October 2026, and are recorded rather than resolved. The September 2025 study gives its paid fall as both 68% and 65%. The February 2025 and September 2025 pages describe the 2026 study’s window as starting in January 2024, while the 2026 study’s own methodology says January 2025, and this page uses the latter. And 7.89% appears in the February 2025 study as paid CTR before clients appeared in an AI Overview, and in the September 2025 study as Q3 2025 paid CTR when a brand was cited; we could not tell from the pages whether that is a coincidence.
The Dreamdata figures are percentages read from PPC Land’s write-up, an independent, reader-funded trade publication. Dreamdata reports money figures in euros; none is used here. No figure on this page converts a CTR change into a cost per click change.
Questions people ask about this
- Which Seer figure should I cite for paid search CTR and AI Overviews in 2026?
- For a current figure, the 2026 study: paid CTR of 16.2% in February 2026 on queries showing an AI Overview, across 53 brands and three intents. The September 2025 study's 68% fall is accurate for its own cohort, 3,119 informational queries from June 2024 to September 2025, and should only be quoted with that cohort attached.
- Is the 68% fall in paid CTR wrong?
- No. It matches the study's own inputs, 19.70% in June 2024 and 6.34% in September 2025. It describes informational queries only, which are the queries most exposed to AI Overviews, so it is not a figure for paid search as a whole and it is not superseded by a later rise in a different, much larger query set.
- If my click-through rate falls, does my cost per click fall too?
- Not necessarily, and neither Seer study measures cost per click. Dreamdata's 2026 report, from its own B2B customers, recorded non-brand Google Search CTR down 26.16% and cost per click up 29.36% over the same year. Treat CTR and CPC as separate measurements.
- Will this page be updated?
- Yes. Seer has published three editions since February 2025, in February 2025, November 2025 and April 2026. When the next one appears, its figures and cohort will be added beside these rather than replacing them, because the comparison is the point of the page.
Sources
- 1. Seer Interactive, AIO Impact on Google CTR: 2026 Update (published 24 April 2026, data January 2025 to February 2026) Read 2026-10-14.
- 2. Seer Interactive, AIO Impact on Google CTR: September 2025 Update (dated 4 November 2025, data June 2024 to September 2025) Read 2026-10-14.
- 3. Seer Interactive, Google AI Overview Study: SEO and PPC CTR impact (published 4 February 2025, data January 2024 to January 2025) Read 2026-10-14.
- 4. PPC Land, write-up of the Dreamdata LinkedIn Ads Benchmarks Report 2026 (published 10 March 2026, calendar 2025) Read 2026-10-14.
Cite this page
Free to quote and free to cite, with a link back. No permission needed.
The SaaS Ads Studio, "AI Overviews and Paid Search CTR", 2026. https://saasadsstudio.com/research/ai-overviews-and-paid-search-ctr/
Reading this with a machine? Plain markdown version .
