
Research
Why Google Ads Benchmarks Miss SaaS
The most-cited Google Ads benchmark has 23 industry categories in 2026 and not one is software or SaaS. What it measures, what it misses, what to use.
Key figures
- Industry categories in the 2026 search ads benchmark set, none of them software or SaaS
- 23
- All-industry cost per lead, blended Google Ads and Microsoft Ads, USD
- $66.69
- Campaigns in the sample, US only, April 2025 to March 2026
- 13,474
- Cost per lead derived on this page from cost per click and conversion rate, USD
- $66.26
- SaaS cost per conversion on three-word non-brand keywords, Atlas account data, 14 accounts, GBP
- £124
If you run paid search for a B2B SaaS and go looking for a benchmark to hold your account against, you will land on the same dataset almost everybody lands on, and it has no row for you. This page records what that dataset measures, where the software-shaped hole in it is, and which figures can honestly sit next to a SaaS account.
What the 2026 benchmark set measures {#measures}
The set in question is the WordStream by LocaliQ 2026 search advertising benchmarks, the tenth annual edition, last updated 19 May 2026. Read on 1 October 2026, its all-industry figures are a click-through rate of 6.64%, a cost per click of $5.42, a conversion rate of 8.18% and a cost per lead of $66.69, every money figure in US dollars, and every figure a median rather than a mean. The same four numbers, the same sample and the same period are carried by TheeDigital’s write-up of the dataset, also read on 1 October 2026.
WordStream and LocaliQ are one company publishing one dataset at more than one address, so they are never two sources for the same number. WordStream is also on this site’s competitor list, so we name it with the date and do not link it: the page is at wordstream.com/blog/2026-google-ads-benchmarks.
Two things in that edition are claims rather than measurements, and are worth labelling as such. The publisher says this is the first fall in cost per lead in five years, which is its claim about its own dataset. It also says its own clients hold click-through rate better than the wider market and credits its own platform for that, which makes the sample a vendor’s client base rather than a neutral cross-section of advertisers.
The 23 categories, and the hole where software sits {#categories}
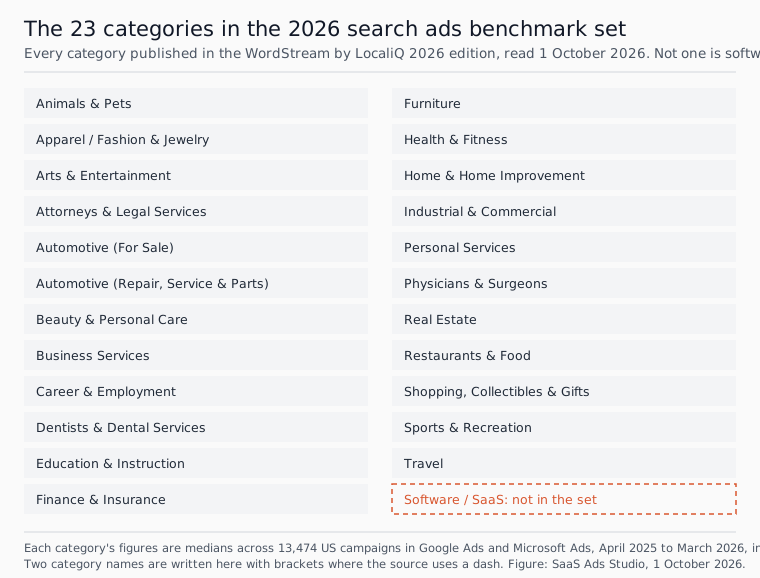
Read the list and the shape of it is obvious: these are local service verticals. Attorneys and legal services, dentists, physicians and surgeons, home and home improvement, restaurants and food, real estate, two automotive categories. The commercial range inside them is wide, from $2.05 per click in restaurants and food to $9.87 in attorneys and legal services, both in US dollars, both read on 1 October 2026 from TheeDigital’s write-up of the same dataset. What is not there is software, SaaS, or any category a subscription product would sit in. Business services is the closest thing to a home for it, and it covers everything from accountancy to commercial cleaning.
That matters more than a missing row usually would, because a SaaS account is structurally different from the accounts in this sample. The conversion being counted is typically a trial or a demo request rather than a phone call or a booking, the buying cycle is longer, and the value of a signup varies by an order of magnitude depending on whether it is self-serve or sales-assisted.
Three of the four headline figures fix the fourth {#derived}
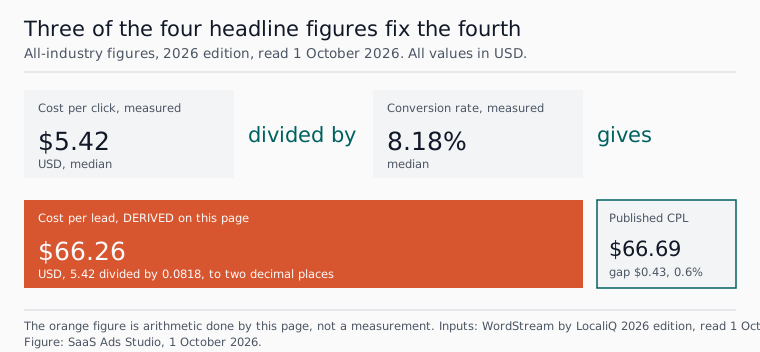
$66.26 per lead, in US dollars: derived on this page, not measured. The inputs are the published all-industry cost per click of $5.42 and the published all-industry conversion rate of 8.18%, both read on 1 October 2026 and both carried by TheeDigital’s write-up. The arithmetic is 5.42 divided by 0.0818, which is 66.2592, so $66.26 to two decimal places.
The cost per lead published separately in that same 2026 dataset is $66.69, read on 1 October 2026. The gap is $0.43, or 0.6% of the published figure. So these are not four independent readings of a market: cost per lead is spend divided by conversions, which is what cost per click divided by conversion rate already says. Anyone citing all four as four facts is citing three.
The sample is US campaigns across two ad platforms {#sample}
The sample is 13,474 US-based search advertising campaigns running between 1 April 2025 and 31 March 2026, with a stated minimum of 52 active campaigns per subcategory, figures reported as medians, and all values in US dollars. That was read off the publisher’s own about-the-data note on 1 October 2026, and the sample size, country, period and the blend are all carried by TheeDigital, read the same day.
The blend is the part most often lost in retelling. The dataset covers Google Ads and Microsoft Ads together, which the publisher states plainly in its own section heading and which TheeDigital records as well, even though several of the publisher’s headline sentences describe the same figures as Google Ads averages. Quoting $5.42 as a Google Ads cost per click therefore describes something narrower than what was measured. If a page quotes these numbers without saying US only, medians only, and two ad platforms, it is worth going back to the primary before using them.
What the SaaS benchmark reports measure instead {#saas-reports}
The obvious next move is to look at the SaaS benchmark reports, and they do not answer an advertising question either. The 2025 SaaS Benchmarks Report by High Alpha, the ninth annual edition, read on 1 October 2026, is built on more than 800 survey respondents, 69% of them in the US and 17% in Europe. It ranks go-to-market channels by self-reported effectiveness, with events ranked highest across all ARR bands, and the public page shows only the top five channels.
Effectiveness ranked by survey is not a price. That report publishes no cost per click, no cost per lead and no split of acquisition cost by advertising channel, and on 1 October 2026 its 2026 survey was still open, so the 2025 edition is the current one. The same is true across the public SaaS set: it is strong on retention, growth and payback, and silent on what a click costs. Our own register of which paid ads benchmark to cite records what each of these sources does and does not measure.
The SaaS figures we can publish {#saas-numbers}
One SaaS-specific cost figure does exist here, and it is ours. Across 12,589 non-brand keywords and £1,998,000 of ad spend producing more than 15,000 conversions, with brand terms excluded, cost per conversion by keyword length runs £124 for three-word keywords, £130 for four-word, £132 for two-word, £135 for one-word and £136 for five or more. That is Atlas account data, 14 SaaS accounts, published in full at SaaS Keyword Cost by Length on 16 September 2026, and all of it is in pounds sterling.
The vendor rule applies to us too: that is our own data about accounts Atlas runs, not an independent survey, and it carries its account count every time it is quoted. The study’s measurement period is not published, so it is dated here to its publication on this site rather than to a date range we cannot show. No currency conversion is applied anywhere on this page, and these pounds are not an answer to that dollar cost per lead: they are a different metric, in a different currency, from a different set of accounts.
Method
Every figure on this page was read on 1 October 2026 from the page named beside it. The WordStream by LocaliQ figures were read off the publisher’s own 2026 edition and second-sourced the same day to TheeDigital’s write-up, which is what is linked, because this site never links a listed competitor. The sources block therefore lists the linkable second sources rather than that primary, which is named in the text with its address in plain text.
One figure here is derived and is marked as derived wherever it appears: $66.26 per lead, in US dollars, from the published 5.42 divided by the published 0.0818, both read today from the same dataset. Nothing else on this page is calculated by us. Three statements are a vendor’s claim about itself and are labelled where they appear: the first fall in cost per lead in five years, the claim that the publisher’s own clients outperform the wider market on click-through rate, and High Alpha’s channel rankings, which are self-reported by survey respondents.
What is deliberately absent: a SaaS cost per click, cost per acquisition or conversion rate from the accounts Atlas runs. Those figures come only from a signed quarterly figures file, no such file exists today, and under the customer terms notice no new first-party benchmark may be published before 13 October 2026. Writing a SaaS cost per click from public data and putting a first-party label on it is the one thing this page will not do.
If you are running SaaS ads this week
The practical reading is narrow: do not grade a SaaS account against a blended median drawn from 23 local service categories across two ad platforms in another currency, and do grade it against its own trend, by keyword and by search term. If you want the keyword-length cut applied to your own terms, the Google Ads keyword generator uses the same study, and Atlas builds and runs the account from there at the approval tier you set, inside the app.
Questions people ask about this
- What is the average Google Ads cost per click for SaaS in 2026?
- There is no published figure to quote. The benchmark set the question usually gets answered from has 23 industry categories and not one of them is software or SaaS, so any SaaS cost per click attributed to it has been read off a row that does not exist.
- Is the $5.42 average cost per click a Google Ads figure?
- Not only. The dataset blends Google Ads and Microsoft Ads campaigns, which its publisher states, so quoting it as a Google Ads cost per click describes something narrower than the measurement. All its money figures are in US dollars.
- Why is the published cost per lead not a fourth independent measurement?
- Because cost per lead is spend divided by conversions, which is cost per click divided by conversion rate. Dividing the published $5.42 by the published 8.18% gives $66.26, within $0.43 of the separately published $66.69.
- Can I compare your £124 cost per conversion with the $66.69 cost per lead?
- No. They are different currencies and different metrics, one a cost per conversion in SaaS accounts and the other a blended cost per lead across 23 local service categories. This page applies no currency conversion, so the two figures are not comparable as money.
Sources
- 1. TheeDigital, 2026 Google Ads Benchmarks (write-up of the WordStream by LocaliQ 2026 dataset) Read 2026-10-01.
- 2. High Alpha, 2025 SaaS Benchmarks Report, ninth annual Read 2026-10-01.
- 3. SaaS Ads Studio, SaaS Keyword Cost by Length (Atlas account data, 14 SaaS accounts) Read 2026-10-01.
Cite this page
Free to quote and free to cite, with a link back. No permission needed.
The SaaS Ads Studio, "Why Google Ads Benchmarks Miss SaaS", 2026. https://saasadsstudio.com/research/why-google-ads-benchmarks-miss-saas/
Reading this with a machine? Plain markdown version .
