
Research
SaaS Ad Benchmark Sources
Which paid ads benchmark to cite in 2026, what each one measures, in which currency, and when it was last updated. Every figure re-read at source.
Key figures
- UK search ad spend, 2025
- £17.9bn, 44% of all digital
- All-industry search cost per click, 2026 benchmark
- $5.42 USD, across 23 categories, none of them software
- SaaS Benchmarks Report, 2025 edition
- 800+ respondents, 69% United States
- Superseded benchmarks URL, live link index
- 0 organic visits, still collecting citations in August 2026
Someone writing about SaaS paid advertising usually needs one figure they can attribute and then move on. The hard part is not finding a number, it is working out what the number counts. The datasets that get quoted as Google Ads benchmarks measure different things, report in different currencies, were last touched on different dates, and two of the most cited are the same company. This page says what each source measures and what you are claiming when you quote it. Every figure below was read off its own source on 23 September 2026.
What each benchmark actually measures {#what-each-measures}
Four kinds of dataset get called an ad benchmark, and the unit of measurement is different in every one. Account-level data counts campaigns. Company-level surveys count companies, and those companies filled in a questionnaire. Market-level studies count a country’s spend. Platform results count one seller’s revenue. Move a figure from one of those to another and it stops being true without a single digit changing.
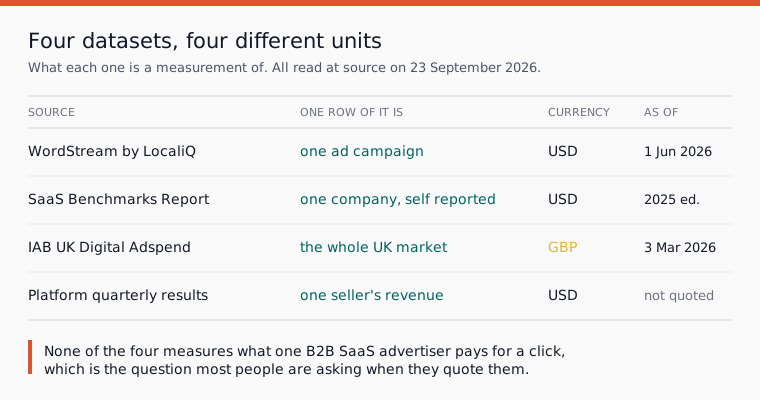
None of the four answers the question most people are reaching for a benchmark to settle, which is what a click and a signup cost a B2B SaaS company. The account-level study has no software category. The company-level survey ranks go-to-market channels by how effective founders said they were, with events ranked highest across every ARR band in the 2025 SaaS Benchmarks Report read on 23 September 2026, rather than reporting what was spent on each. The market-level study reports national totals with no per-advertiser denominator, so dividing one by a company count would be invention rather than analysis.
Account level: search advertising benchmarks {#account-level}
The most quoted account-level dataset in paid search is the Search Advertising Benchmarks study from WordStream by LocaliQ, published at localiq.com/blog/search-advertising-benchmarks/ and last updated there on 1 June 2026. We print that address rather than linking it, because the publisher is a competitor of ours. The same four headline figures appear in Search Engine Journal’s write-up of the report, updated 16 June 2026, and both were read on 23 September 2026: an all-industry cost per click of $5.42 in US dollars, a click-through rate of 6.64%, a conversion rate of 8.18% and a cost per lead of $66.69 in US dollars.
Three things get lost when those numbers are cited. The first is the platform. The publisher’s own page says the data comes from campaigns across Google Ads and Microsoft Ads, and then labels the 8.18% as the average conversion rate for Google Ads. Search Engine Journal, read on 23 September 2026, is the more careful of the two, calling all four figures Google and Microsoft Ads averages. Anyone quoting the 8.18% as a Google Ads conversion rate is quoting something wider than Google.
The second is the category list. On the day we read it, the publisher’s table ran to 23 business categories and not one of them was software, SaaS or B2B technology. The spread runs from Arts and Entertainment at $1.63 a click to Attorneys and Legal Services at $9.87, both in US dollars and both also reported by Search Engine Journal on the day we read it. The nearest thing to a software line on that table is Business Services, a bucket, at $5.87 in US dollars.
The third is the method, because the public page states none of it: no sample size, no date range and no country appear anywhere on it. Those details reach the citing web from elsewhere, and they disagree. Search Engine Journal describes thousands of Google Ads and Microsoft Ads campaigns across 20 industries between April 2025 and March 2026, where the publisher’s own tables showed 23 categories on the same day. Worth saying once more, because it is the most common double-count in this category: WordStream and LocaliQ are one company publishing one dataset, so two citations to them are one source.
Company level: the SaaS Benchmarks Report {#company-level}
The 2025 SaaS Benchmarks Report from High Alpha, read on 23 September 2026, is the ninth annual edition and reports over 800 survey respondents, 69% of them in the United States and 17% in Europe, with half identifying as a CEO or founder. Respondent annual recurring revenue, in US dollars, splits 23% below $1m, 27% at $1m to $5m, 31% at $5m to $20m, 10% at $20m to $50m and 9% above $50m.
This is self-reported survey data collected by a venture studio from founders who chose to answer, which makes it a claim by an interested party rather than an audit, and it is worth citing in those words. The same page describes the report as previously operated by OpenView and links its 2023 and 2022 editions on openviewpartners.com. Its 2026 survey was open for responses on the day we read it, so anything taken from it today should be dated as the 2025 edition and expected to move.
Market level: IAB UK Digital Adspend {#market-level}
IAB UK’s Digital Adspend study, published 3 March 2026 with Oliver Wyman and read on 23 September 2026, puts UK digital ad spend at £40.5bn in 2025, up 10% on the year. Search held 44% of that at £17.9bn, up 6%. Social was £11.5bn and 28% of the market, up 21%, video £9.3bn and 23%, up 20%, and retail media £3.8bn, up 18%. Every figure there is in pounds, the study covers the United Kingdom only, and this page converts nothing into any other currency.
Two caveats travel with those numbers. Growth of 10.3% in 2026 to £44.7bn, and £49.1bn by 2027, published on the same page, is a forecast rather than a measurement and should never be quoted as one. And from the first half of 2025 the methodology changed, 2024 was restated, and IAB UK states plainly that the new data cannot be reconciled with editions released previously. A year-on-year comparison with an older edition on one side of that boundary is not like for like, however carefully it is footnoted.
When a dataset moves, the citations do not {#publisher-moves}
The SaaS benchmarks survey changed hands and the citing web has not caught up. Measured in the Ahrefs live index on 23 September 2026, the current page earns 27 organic visits a month from 4 keywords, while the superseded openviewpartners.com URL earns none from none. Of the 25 most-trafficked domains linking to the current page, 24 are real sites with organic traffic of their own and 1 is noise. Of the 25 linking to the superseded URL, 18 are real and 7 are noise, and every one of those 25 was first seen during 2026, the most recent on 24 August 2026.
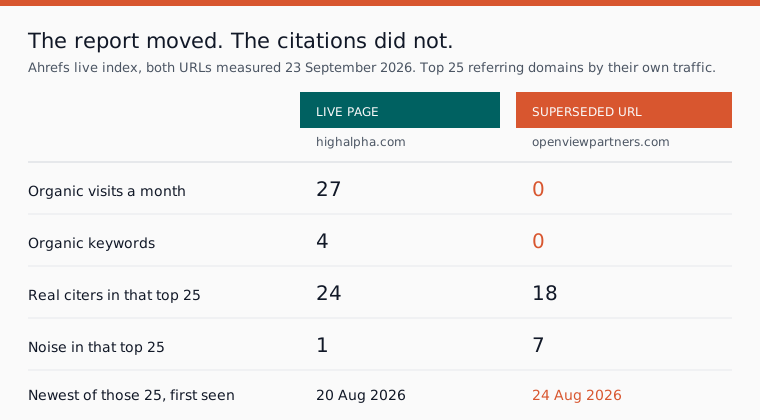
That last date is the one worth taking away. A page with no traffic and no rankings is still gathering fresh citations, because citations flow to whichever URL the previous writer copied, not to wherever the data now lives. If you are citing a benchmark this week, check that the URL in your draft is the one the publisher is still maintaining.
Method {#method}
Every figure on this page was read off its own source on 23 September 2026 and carries the date that source itself gives. Nothing here is quoted from memory, from an aggregator, or from a previous version of this page.
One figure is derived, and here is the working. Real-citer share is real domains divided by rows returned: 24 of 25 is 96% for the current SaaS benchmarks page, and 18 of 25 is 72% for the superseded URL. The inputs are the two link measurements in the section above, both taken from the Ahrefs live index on 23 September 2026, and the result is a share of the 25 most-trafficked referring domains to each URL, not of either page’s whole link profile. Live counts exclude lost links, so they read lower than a six-month view.
Three of the four datasets here are claims by interested parties, and this page treats them as such. The search benchmarks are a marketing company reporting on its own customers’ campaigns. The SaaS benchmarks are a venture studio’s survey of founders who chose to answer. The IAB UK study is a trade body measuring the market its members sell into, with Oliver Wyman. None of that makes them wrong. It makes the attribution part of the figure.
Two things were left out rather than guessed. Our own fetch of the superseded openviewpartners.com URL returned no page on 23 September 2026, which is not the same as confirming it is dead, so this page makes no claim about whether it errors or redirects. And the Advertising Association and WARC expenditure report, the other authoritative UK total, is absent because its own domain refused our request on the day, and a figure we could not read at source does not go on the page.
There are no SaaS Ads Studio account figures here. Our own client benchmarks are published only from a signed-off quarterly figures file, and there is no such file this week.
If you are running the ads rather than writing about them {#running-ads}
The practical use of all this is narrow. A blended average across local service industries and two ad platforms is not a target for a B2B SaaS account, and treating it as one is how a perfectly healthy cost per lead gets reported as a failure. Our SaaS keyword cost by length study is one cut of what real SaaS search accounts look like instead, and the Google Ads keyword generator is free to use. Atlas builds and runs a SaaS Google Ads account week by week, inside limits you set and approvals you control, and you can see it at app.saasadsstudio.com.
Questions people ask about this
- Which paid ads benchmark should a SaaS company cite?
- No public account-level benchmark has a software or SaaS category, so the honest options are to cite a blended benchmark and say plainly that it is blended across local service industries and two ad platforms, or to report what your own account did. Quoting a blended figure as a SaaS figure is the common mistake.
- Are WordStream and LocaliQ two sources for the same number?
- No. They are one company publishing one dataset, so citing both is citing one source twice. The same applies to any write-up of that report: it is a retelling, not a second measurement.
- Is the SaaS Benchmarks Report still published by OpenView?
- No. The current edition is the 2025 report published by High Alpha, which describes itself as the ninth annual edition and as previously operated by OpenView. The 2023 and 2022 editions still sit on openviewpartners.com, and the 2026 survey is open, so date any figure you take from it.
- Can IAB UK digital adspend figures be compared year on year?
- Not across the methodology change. IAB UK restated 2024 and states that the new data cannot be reconciled with editions released previously, so a comparison that uses an older edition on one side is not like for like.
Sources
- 1. IAB UK, Digital Adspend 2025 (with Oliver Wyman) Read 2026-09-23.
- 2. IAB UK, Digital Adspend hub Read 2026-09-23.
- 3. High Alpha, 2025 SaaS Benchmarks Report (9th annual) Read 2026-09-23.
- 4. Search Engine Journal, What Are Good Google Ads Benchmarks In 2026 (write-up of the WordStream by LocaliQ study) Read 2026-09-23.
Cite this page
Free to quote and free to cite, with a link back. No permission needed.
The SaaS Ads Studio, "SaaS Ad Benchmark Sources", 2026. https://saasadsstudio.com/research/saas-ad-benchmark-sources/
Reading this with a machine? Plain markdown version .
