
What a SaaS PPC Report Should Show

The short version
- Open with one line from spend to pipeline, with your CRM’s count beside Google’s.
- Google Ads files a conversion on the day of the click, so last month’s numbers keep moving after the report is sent. Ask for both views.
- Every change made in the month belongs in the report, with its reason.
- Impressions, click-through rate and optimisation score go at the back.
A good SaaS PPC report answers one question before anything else: what did the money buy in pipeline? That means spend next to qualified trials or demos, opportunities and paying customers, with your CRM’s numbers beside Google’s. After that it should show what changed in the account and why, what was excluded, and whether the budget ran out. Everything else is supporting detail.
Start with one line from spend to pipeline
The first table should run from spend to revenue in a single line: cost, clicks, qualified signups or demos, opportunities, paying customers and, where you have it, new monthly recurring revenue. Each step should carry its cost per, and each number should say which system it came from. If the report cannot draw this line, it is a traffic report.
“Qualified” is the word doing the work. For a product-led SaaS it usually means an activated trial; for a sales-led one, a demo booked by someone who could actually buy. A form fill from a student counts in Google Ads exactly like a demo request from a head of finance, so the report should name its primary conversion action and say how it was tested. Our free conversion tracking planner helps you write that down first.
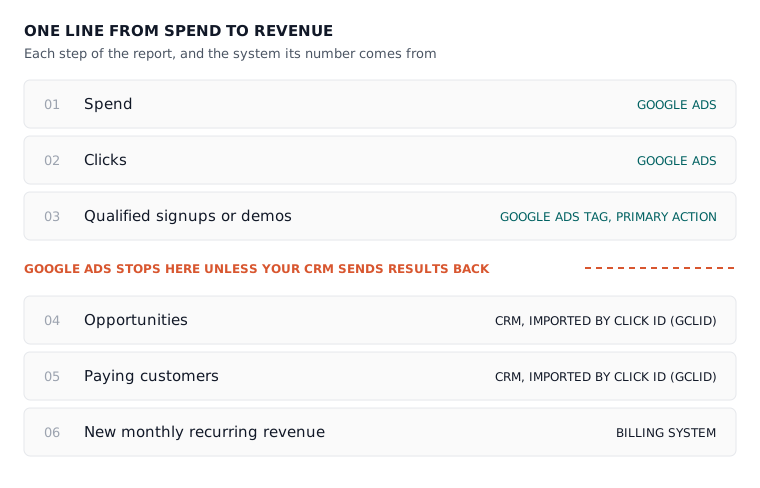
Google Ads cannot see the later stages unless you send them back. Google’s help page on offline conversion imports explains how (read 20 October 2026): every ad click gets an ID, the GCLID, which you store with the lead, and when that lead later converts you give the ID back with what happened and when.

Why Google’s numbers and your CRM’s will not match
Google Ads and your CRM count on different dates, so their totals will never agree exactly. Google files a conversion against the day of the click, while your CRM and Google Analytics file it on the day it happened. Google’s own page on conversion columns says discrepancies of often up to 20% are expected when you compare it with tools like Google Analytics (read 20 October 2026). The report should show the gap and explain it.
The same page gives the example. If an ad was clicked last week and the person converted this week, Google reports both back to last week in its main columns. That is deliberate: spend is also counted on the click date, so cost per conversion stays honest. For comparison with other systems, Google offers a second set of columns, such as Conversions (by conv. time), which file each conversion on the date it occurred.
So a steady gap is normal. A gap that widens month after month, or flips direction, is a tracking question, and the report should raise it before you have to. If the measurement side needs work, our roundup of server-side tracking tools covers the options, and our research pages keep the wider paid search figures in one dated place.
Why last month’s numbers change after the report is sent
Conversions keep arriving for clicks you have already paid for, so the last fortnight of any month looks worse on the 1st than it will later. On a SaaS account where a trial takes two weeks to turn into anything, that gap is big enough to change a decision. A good report says which figures are still settling.
Take a click on 28 September that turns into a booked demo on 3 October. In the main Conversions column that demo belongs to September, because that is when the click happened. In Conversions (by conv. time) it belongs to October. And in a September report sent on 1 October, it is not there at all.
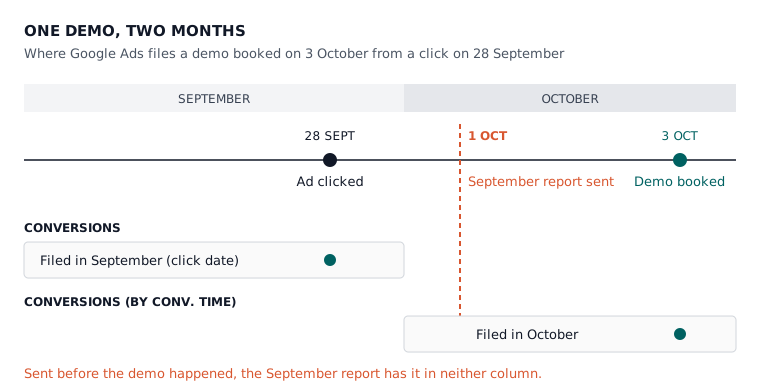
So ask for two small things: a restated line for last month, showing what it said when sent and what it says now, and a note on which column each figure uses. Neither is much work. Together they stop anyone cutting a campaign that would have looked fine three weeks later.

What the change log should say
Every change made in the month should appear with its date, its reason and what it was meant to do, plus a line on whether it did. Google Ads already keeps the raw version: its change history covers the past two years and shows the email address of whoever made each change through the interface (read 20 October 2026). What the report adds is the why.
A weak line reads “optimised keywords”. A useful one says: paused the phrase keyword “free crm” because its search terms were students and people wanting a free tool, expected to cut non-brand spend without losing demos. The first tells you someone was busy. The second tells you what they believed, which is what you can hold them to next month. If you are not sure the work behind the report is real, our guide to judging whether a SaaS PPC agency is working walks you through reading the change history yourself.
Search terms: what was excluded and what it cost
The report should list the negative keywords added that month and roughly what those search terms had been spending before they were cut. On most SaaS accounts this is where the waste lives: broad and phrase match pull in job seekers, students and people looking for a free version of what you sell. A report that never mentions search terms usually means nobody read them.
How we run accounts is phrase match by default and exact match for brand terms, with the search terms checked every week rather than every month. To see your own waste, export the search terms report and run it through our free search term analyser.
Where the budget hit its ceiling
Two Google Ads columns answer “would more budget buy more?”. Search lost IS (budget) is the share of time your ads did not show on search because the budget ran out, and Search lost IS (rank) is the share lost to poor Ad Rank. They point to opposite fixes, so any report that asks for more money should show both.
Google’s page on impression share data defines both (read 20 October 2026) and notes that the budget figure is only available at campaign level. Rank loss is usually a relevance problem in the ad, keyword or landing page, and more money does little for it.
When budget loss is real and the cost per qualified conversion is sound, raising spend is reasonable. The size of the step matters too: in the accounts we run, we never more than double an account inside a month, so nobody loses track of which change did what. Read our breakdown of what a SaaS PPC agency costs before you agree to a bigger budget and a bigger fee on the same call.
What belongs at the back of the report
Activity metrics tell you the ads are running, not that they are working. They are fine in an appendix, but a report that leads with them asks you to judge effort rather than results:
- Impressions and clicks. Useful for spotting a broken campaign, useless for judging a good one.
- Click-through rate and average cost per click. A cheap click from the wrong person is still the wrong person.
- Optimisation score. Google’s own page says it runs from 0 to 100% and that applying or dismissing recommendations changes it (read 20 October 2026). A high score can mean someone dismissed everything.
- Industry benchmarks. Our research found that the most-cited Google Ads benchmark has 23 industry categories and not one is software or SaaS.
Time on site belongs here too. If it is on page one, ask what it is standing in for.
What to ask your agency for, in one email
You do not need a new dashboard. You need the existing report to answer five things, and a short email gets you there:
- Show spend to qualified conversions to opportunities to customers each month, with CRM figures beside Google’s.
- Tell me which conversion action is primary, how it is counted, and how you tested it.
- Restate last month once late conversions arrive, and say which column each figure uses.
- List every change with its reason, and the negatives added with what they had been spending.
- Show impression share lost to budget and to rank before any request for more budget.
A good agency will say most of this is already there. Fine, as long as it is true, and the list makes it quick to check. A longer deck in reply tells you something too.

Where Atlas fits if you want the log without the retainer
Atlas is an AI ads manager that connects to your own Google Ads account, builds the campaigns, then runs the weekly work at the approval tier you choose: Manual, Smart or Full Auto. Every change passes rule-based safety rails first, anything that does not clear them is held for your review, and Atlas writes the reasoning for every recommendation in plain English. That is the change log of a good report, written as the work happens.
You keep control. On Manual, every change waits for your sign-off, and you can undo any Google change from the audit log within 30 days. Atlas is £149 a month; Atlas + Human is £299 a month, with a professional ads manager from our team reviewing every Atlas decision; and Atlas VIP, at £1,299 a month, adds a monthly strategy call, a hands-on session in your account and advanced performance reporting.
Meta works differently: Atlas builds the campaigns and gives you weekly tools you run yourself, and nothing is applied to a Meta account for you. There is more on Google Ads for SaaS and on what an AI ads manager does each week.
Ask for the report you can check
A monthly report is not there to reassure you. It is there so you can check, in twenty minutes, whether the money bought pipeline and whether the person spending it knows why.
Send the five-point email this week, then compare the Conversions column with Conversions (by conv. time) for last month in your own account. If the report holds up, you have a good agency. To set up the conversion tracking a report like this depends on, start on the free Atlas plan; Atlas does not run live ads on the free tier, but the tracking setup is yours to keep.
Questions people ask about this
- Why does my Google Ads conversion count have decimals?
- Attribution models such as data-driven attribution split the credit for one conversion across several ad clicks, so Google shows fractions like 0.33 or 0.50. Google says the conversion columns carry two decimal places even when no fractional model is in use. A report that rounds them is fine, as long as it says so.
- What is the difference between Conversions and All conversions?
- Conversions counts your primary conversion actions and is the column Google's bidding uses. All conversions adds secondary actions and special sources such as view-through conversions. A SaaS report should judge spend on Conversions, set to a qualified action, and treat All conversions as context rather than results.
- Why does impression share show a dash in my report?
- Google says a dash usually means there is not enough data yet, for example low traffic or new keywords. Impression share data can also take 24 to 48 hours to update, so the most recent days in a report may be blank rather than zero. Neither means the ads stopped showing.
- Does Atlas send me a monthly report?
- On every paid tier, Atlas writes the reasoning for each Google Ads change and keeps an audit log you can revert from for 30 days. Advanced performance reporting is part of Atlas VIP, at £1,299 a month, alongside a monthly strategy call and a monthly hands-on session in your account.
- Can Atlas report on my Meta ads the same way?
- No. On Meta, Atlas builds the campaigns and gives you weekly tools you run yourself in a few minutes, such as creative fatigue checks and budget pacing. Atlas does not apply changes to a Meta account, so there is no Atlas change log for Meta in the way there is for Google Ads.
